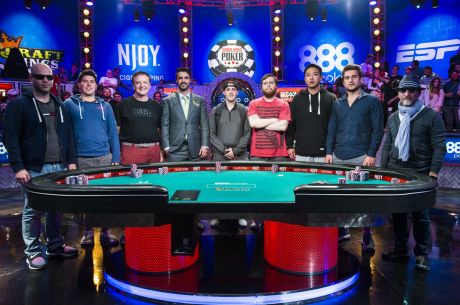
Big Data : Joe McKeehen imitera-t-il Greg Raymer, Jamie Gold et Jonathan Duhamel ?

Le Main Event des World Series of Poker 2015 est en pause et les November Nine ont d��sormais presque quatre mois de pr��paration avant l'affrontement terminal. Le chipleader Joe McKeehen poss��de 32.8% des jetons et plus du double du tapis de son dauphin, Zvi Stern. L'Am��ricain n'est pas assur�� de la victoire mais un podium semble presque certain.
PokerNews ��tudi�� les donn��es depuis 2004 et 8 des 11 derniers chipleaders �� l'entame de l'ultime table se sont hiss��s dans le Top 3. Joe McKeehen doit donc encore conclure mais l'importance de son avance semble bien le destiner �� am��liorer la statistique pr��c��dente.
Une seule fois durant les ann��es ��tudi��es, le chipleader a termin�� hors du Top 5. En 2007, Philip Hilm avait craqu�� et jou�� �� l'envers pour finalement sortir en 9e position ! L'exp��riment�� McKeehen ne devrait pas faire cette erreur et s'octroyer un joli billet en novembre.
Le chipleader du Main Event 2015 poss��de presque 84 grosses blindes d'avance sur le deuxi��me du classement provisoire soit plus que tous les autres concurrents de la Table Finale. Zvi Stern, deuxi��me du classement, d��butera en effet avec 75 blindes.
McKeehen n'est toutefois pas le joueur qui entre en finale avec le plus d'avance puisqu'en 2009, l'ann��e de la victoire de Joe Cada, Darvin Moon avait commenc�� la TF avec 100 blindes d'avance sur son dauphin. Le bucheron avait finalement termin�� �� la deuxi��me place pour plus de 5 millions de dollars.
L'addition du tapis des cinq derniers du classement provisoire est ��quivalent �� celui du chipleader qui a donc clairement son destin entre les mains pour ��viter un destin �� la Hilm.
Enfin, McKeehen est le joueur sur la p��riode qui entrera en Table Finale avec la plus grosse proportion de jetons du Main Event WSOP. Avec 32,8%, il devance d��sormais les 32,4% de Greg Raymer. Fossilman avait triomph�� en 2004 et Joe McKeehen compte bien l'imiter... Aucun joueur d��tenant plus de 30 % des jetons ne s'est d'ailleurs class�� au-del�� de la seconde place : Greg Raymer, Jamie Gold (32,66 %) et Jonathan Duhamel (30,03 %) se sont tous impos��s !
Voici les chiffres pour les Tables Finales depuis 2004 avec la situation au d��but de la derni��re bataille et le classement final.
| Ann��e | Joueur | Jetons | % des jetons | BBs | Classement |
|---|---|---|---|---|---|
| 2015 | Joe McKeehen | 63,100,000 | 32.8% | 158 | -- |
| Ofer Zvi Stern | 29,800,000 | 15.5% | 74.5 | -- | |
| Neil Blumenfield | 22,000,000 | 11.4% | 55 | -- | |
| Pierre Neuville | 21,075,000 | 10.9% | 53 | -- | |
| Max Steinberg | 20,200,000 | 10.5% | 50.5 | -- | |
| Thomas Cannuli | 12,250,000 | 6.4% | 31 | -- | |
| Josh Beckley | 11,800,000 | 6.1% | 29 | -- | |
| Patrick Chan | 6,225,000 | 3.2% | 16 | -- | |
| Federico Butteroni | 6,200,000 | 3.2% | 15.5 | -- | |
| 2014 | Jorryt van Hoof | 38,375,000 | 19.1% | 96 | 3rd - $3,807,753 |
| Felix Stephensen | 32,775,000 | 16.3% | 82 | 2nd - $5,147,911 | |
| Mark Newhouse | 26,000,000 | 13.0% | 65 | 9th - $730,725 | |
| Andoni Larrabe | 22,550,000 | 11.2% | 56.5 | 6th - $1,622,471 | |
| Dan Sindelar | 21,200,000 | 10.6% | 53 | 7th - $1,236,084 | |
| Billy Pappas | 17,500,000 | 8.7% | 44 | 5th - $2,143,794 | |
| William Tonking | 15,050,000 | 7.5% | 38 | 4th - $2,849,763 | |
| Martin Jacobson | 14,900,000 | 7.4% | 37 | 1st - $10,000,000 | |
| Bruno Politano | 12,125,000 | 6.0% | 30 | 8th - $947,172 | |
| 2013 | JC Tran | 38,000,000 | 19.9% | 95 | 5th - $2,106,893 |
| Amir Lehavot | 29,700,000 | 15.6% | 74 | 3rd - $3,727,823 | |
| Marc Etienne McLaughlin | 26,525,000 | 13.9% | 66.5 | 6th - $1,601,024 | |
| Jay Farber | 25,975,000 | 13.6% | 65 | 2nd - $5,174,357 | |
| Ryan Riess | 25,875,000 | 13.6% | 65 | 1st - $8,361,570 | |
| Sylvain Loosli | 19,600,000 | 10.3% | 49 | 4th - $2,792,533 | |
| Michiel Brummelhuis | 11,275,000 | 5.9% | 28 | 7th - $1,225,356 | |
| Mark Newhouse | 7,350,000 | 3.9% | 18.5 | 9th - $733,224 | |
| David Benefield | 6,375,000 | 3.3% | 16 | 8th - $944,650 | |
| 2012 | Jesse Sylvia | 43,875,000 | 22.2% | 146 | 2nd - $5,295,149 |
| Andras Koroknai | 29,375,000 | 14.8% | 98 | 6th - $1,640,902 | |
| Greg Merson | 28,725,000 | 14.5% | 96 | 1st - $8,531,853 | |
| Russell Thomas | 24,800,000 | 12.5% | 83 | 4th - $2,851,537 | |
| Steve Gee | 16,860,000 | 8.5% | 56 | 9th - $754,798 | |
| Michael Esposito | 16,260,000 | 8.2% | 54 | 7th - $1,258,040 | |
| Rob Salaburu | 15,155,000 | 7.7% | 50.5 | 8th - $971,360 | |
| Jake Balsiger | 13,115,000 | 6.6% | 44 | 3rd - $3,799,073 | |
| Jeremy Ausmus | 9,805,000 | 5.0% | 32.5 | 5th - $2,155,313 | |
| 2011 | Martin Staszko | 40,175,000 | 19.5% | 80.5 | 2nd - $5,433,086 |
| Eoghan O��Dea | 33,925,000 | 16.5% | 68 | 6th - $1,720,831 | |
| Matt Giannetti | 24,750,000 | 12.0% | 49.5 | 4th - $3,012,700 | |
| Phil Collins | 23,875,000 | 11.6% | 48 | 5th - $2,269,599 | |
| Ben Lamb | 20,875,000 | 10.1% | 42 | 3rd - $4,021,138 | |
| Bob Bounahra | 19,700,000 | 9.6% | 39.5 | 7th - $1,314,097 | |
| Pius Heinz | 16,425,000 | 8.0% | 33 | 1st - $8,715,368 | |
| Anton Makiievskyi | 13,825,000 | 6.7% | 27.5 | 8th - $1,010,015 | |
| Sam Holden | 12,375,000 | 6.0% | 25 | 9th - $782,115 | |
| 2010 | Jonathan Duhamel | 65,975,000 | 30.0% | 132 | 1st - $8,944,310 |
| John Dolan | 46,250,000 | 21.1% | 92.5 | 6th - $1,772,959 | |
| Joseph Cheong | 23,525,000 | 10.7% | 47 | 3rd - $4,130,049 | |
| John Racener | 19,050,000 | 8.7% | 38 | 2nd - $5,545,955 | |
| Matt Jarvis | 16,700,000 | 7.6% | 33.5 | 8th - $1,045,743 | |
| Filippo Candio | 16,400,000 | 7.5% | 33 | 4th - $3,092,545 | |
| Michael Mizrachi | 14,450,000 | 6.6% | 29 | 5th - $2,332,992 | |
| Soi Nguyen | 9,650,000 | 4.4% | 19 | 9th - $811,823 | |
| Jason Senti | 7,625,000 | 3.5% | 15 | 7th - $1,356,720 | |
| 2009 | Darvin Moon | 58,930,000 | 30.2% | 245.5 | 2nd - $5,182,601 |
| Eric Buchman | 34,800,000 | 17.9% | 145 | 4th - $2,502,890 | |
| Steven Begleiter | 29,885,000 | 15.3% | 124.5 | 6th - $1,587,160 | |
| Jeff Shulman | 19,580,000 | 10.0% | 81.5 | 5th - $1,953,452 | |
| Joe Cada | 13,215,000 | 6.8% | 55 | 1st - $8,546,435 | |
| Kevin Schaffel | 12,390,000 | 6.4% | 51.5 | 8th - $1,300,231 | |
| Phil Ivey | 9,765,000 | 5.0% | 40.5 | 7th - $1,404,014 | |
| Antoine Saout | 9,500,000 | 4.9% | 39.5 | 3rd - $3,479,670 | |
| James Akenhead | 6,800,000 | 3.5% | 28 | 9th - $1,263,602 | |
| 2008 | Dennis Phillips | 26,295,000 | 19.2% | 109.5 | 3rd - $4,517,773 |
| Ivan Demidov | 24,400,000 | 17.8% | 101.5 | 2nd - $5,809,595 | |
| Scott Montgomery | 19,690,000 | 14.4% | 82 | 5th - $3,096,768 | |
| Peter Eastgate | 18,375,000 | 13.4% | 76.5 | 1st - $9,152,416 | |
| Ylon Schwartz | 12,525,000 | 9.2% | 52 | 4th - $3,794,974 | |
| Darus Suharto | 12,520,000 | 9.1% | 52 | 6th - $2,418,562 | |
| Chino Rheem | 10,230,000 | 7.5% | 42.5 | 7th - $1,772,650 | |
| Craig Marquis | 10,210,000 | 7.5% | 42.5 | 9th - $900,670 | |
| Kelly Kim | 2,620,000 | 1.9% | 11 | 8th - $1,288,217 | |
| 2007 | Philip Hilm | 22,070,000 | 17.3% | 92 | 9th - $525,934 |
| Tuan Lam | 21,315,000 | 16.7% | 89 | 2nd - $4,840,981 | |
| Jon Kalmar | 20,320,000 | 15.9% | 84.5 | 5th - $1,255,069 | |
| Raymond Rahme | 16,320,000 | 12.8% | 68 | 3rd - $3,048,025 | |
| Lee Childs | 13,240,000 | 10.4% | 55 | 7th - $705,229 | |
| Lee Watkinson | 9,925,000 | 7.8% | 41.5 | 8th - $585,699 | |
| Hevad Khan | 9,205,000 | 7.2% | 38.5 | 6th - $956,243 | |
| Jerry Yang | 8,450,000 | 6.6% | 35 | 1st - $8,250,000 | |
| Alex Kravchenko | 6,570,000 | 5.2% | 27.5 | 4th - $1,852,721 | |
| 2006 | Jamie Gold | 26,650,000 | 29.2% | 166.5 | 1st - $12,000,000 |
| Allen Cunningham | 17,770,000 | 19.5% | 111 | 4th - $3,628,513 | |
| Richard Lee | 11,820,000 | 13.0% | 74 | 6th - $2,803,851 | |
| Erik Friberg | 9,605,000 | 10.5% | 60 | 8th - $1,979,189 | |
| Paul Wasicka | 7,970,000 | 8.7% | 50 | 2nd - $6,102,499 | |
| Doug Kim | 6,770,000 | 7.4% | 42.5 | 7th - $2,391,520 | |
| Rhett Butler | 4,815,000 | 5.3% | 30 | 5th - $3,216,182 | |
| Michael Binger | 3,140,000 | 3.4% | 19.5 | 3rd - $4,123,310 | |
| Dan Nassif | 2,600,000 | 2.9% | 16 | 9th - $1,566,858 | |
| 2005 | Aaron Kanter | 10,700,000 | 19.0% | 107 | 4th - $2,000,000 |
| Tex Barch | 9,330,000 | 16.6% | 93.5 | 3rd - $2,500,000 | |
| Andy Black | 8,140,000 | 14.5% | 81.5 | 5th - $1,750,000 | |
| Mike Matusow | 7,410,000 | 13.2% | 74 | 9th - $1,000,000 | |
| Steve Dannenmann | 5,460,000 | 9.7% | 54.5 | 2nd - $4,250,000 | |
| Joseph Hachem | 5,420,000 | 9.6% | 54 | 1st - $7,500,000 | |
| Daniel Bergsdorf | 5,270,000 | 9.4% | 52.5 | 7th - $1,300,000 | |
| Scott Lazar | 3,370,000 | 6.0% | 34 | 6th - $1,500,000 | |
| Brad Kondracki | 1,180,000 | 2.1% | 12 | 8th - $1,150,000 | |
| 2004 | Greg Raymer | 8,215,000 | 32.4% | 164.5 | 1st - $5,000,000 |
| Matt Dean | 4,920,000 | 19.4% | 98.5 | 7th - $675,000 | |
| Josh Arieh | 3,205,000 | 12.6% | 64 | 3rd - $2,500,000 | |
| Glenn Hughes | 2,275,000 | 9.0% | 45.5 | 5th - $1,100,000 | |
| Dan Harrington | 2,245,000 | 8.9% | 45 | 4th - $1,500,000 | |
| David Williams | 1,575,000 | 6.2% | 31.5 | 2nd - $3,500,000 | |
| Al Krux | 1,305,000 | 5.1% | 26 | 6th - $800,000 | |
| Mike McClain | 885,000 | 3.5% | 17.5 | 9th - $470,400 | |
| Mattias Anderson | 740,000 | 2.9% | 15 | 8th - $575,000 |